
Capital Efficiency Strategies: A Practical Guide for Investors
- Jib Hunt

- Aug 10
- 14 min read

COMPLIANCE NOTE: For educational purposes only. Not financial, tax, or legal advice.
The main types of capital efficiency strategies fall into four categories: investment-level techniques (leverage, portable alpha, capital-efficient instruments), financing and structure approaches (staged debt, self-financing liquidity tools), operational levers (unit economics, working capital management, capex portfolio scrubbing), and analytical/portfolio optimization methods (marginal analysis, real options, constrained optimization). If you are a startup founder, start with unit economics and burn multiple. Corporate CFOs typically see the fastest wins from capex portfolio scrubbing and working capital tightening. Investors benefit most from examining leverage ratios and instrument selection first.
The six to eight concrete strategy types worth knowing:
Investment-level strategies: capital-efficient instruments, leverage management, portable alpha
Financing and structure strategies: staged debt financing, self-financing liquidity tools (including structured whole-life)
Operational unit-economics levers: CAC reduction, LTV extension, pricing discipline
Working capital optimization: receivables acceleration, payables extension, inventory reduction
Capex portfolio scrubbing: small-project rationalization, sustaining capex triage
Portfolio and asset optimization: diversification rebalancing, constrained capital allocation
Analytical optimization techniques: marginal analysis, real options, constrained optimization, simulation
Hybrid capital-control approaches: policy-based liquidity tools for high-income owners and entrepreneurs
Pro Tip: Start with the lever that is already measurable. If you cannot calculate your current burn multiple or ROIC today, you cannot know whether any change is working.
Key Takeaways
Capital efficiency is not a single tactic but a layered program: the most durable gains come from combining operational discipline, disciplined capital allocation, and the right measurement framework for your stage.
Point | Details |
Start with measurement | Calculate burn multiple or ROIC before changing anything; you cannot track improvement without a baseline. |
Match the lever to your stage | Startups gain most from unit economics and burn multiple work; corporates from capex scrubbing (15–30% savings potential per McKinsey); investors from instrument selection and leverage discipline. |
Use analytical techniques deliberately | Marginal analysis, real options, and constrained optimization each answer a different question; apply them to the problem type they are designed for. |
Avoid common pitfalls | Over-leveraging, misaligned incentives, and mistaking short-term efficiency for strategic advantage are the three most frequent implementation failures. |
The Infinite Banker’s role | Dividend-paying whole life may serve as a liquidity-management tool for entrepreneurs and high-income owners; dividends are not guaranteed, and policy loans accrue interest and reduce cash value if unpaid. |
Table of Contents
What are the types of capital efficiency strategies, and why do they matter?
A taxonomy of capital efficiency strategy types with practical examples
How do you choose which capital efficiency lever to test first?
How to implement capital efficiency changes without common mistakes
Where does Infinite Banking fit among capital efficiency strategies?
What are the types of capital efficiency strategies, and why do they matter?
Capital efficiency measures how much economic output a business or portfolio generates per dollar of capital deployed. A simple way to visualize it: efficiency equals output per dollar. The higher that ratio, the less capital you need to achieve the same result, which directly affects runway, valuation, return on invested capital (ROIC), and long-term fund performance.
The stakes differ by audience. For a startup, capital efficiency determines how long the company survives before needing to raise again. A lower burn multiple, meaning less cash burned per dollar of net new ARR, extends runway and reduces dilution. For a corporate finance team, the relevant frame is ROIC relative to the weighted average cost of capital (WACC): a company that consistently earns ROIC above WACC creates shareholder value; one that earns below it destroys it. EY-Parthenon’s analysis of 360 companies found that improving ROIC before committing capital to growth helps companies “earn the right to grow” and improves total shareholder return. For investors, the question is whether the portfolio is generating adequate return per unit of risk and capital, and whether diversification alone is doing the work or whether instrument selection and leverage could improve utility.
BCG research identifies three disciplines that top-performing capital allocators share: strategic capital budgeting, disciplined investment project selection, and rigorous investment governance. Companies that apply all three consistently outperform peers on capital allocation metrics. AQR and EY-Parthenon reinforce this from different angles: AQR from the investor side, EY-Parthenon from the corporate side.
Startups: runway extension, burn multiple reduction, CAC:LTV ratio improvement
Corporates: ROIC improvement, TSR, capex rationalization, working capital efficiency
Investors: risk-adjusted return per dollar, leverage utility, instrument selection
Pro Tip: Before benchmarking your ROIC against an industry average, confirm you are using the same capital base definition. Some peers exclude goodwill; others include it. The difference can swing ROIC by several percentage points.
A taxonomy of capital efficiency strategy types with practical examples
Investment-level strategies
These strategies focus on how capital is deployed across assets and instruments. The core question is whether each dollar is working as hard as it could given the risk budget.
AQR notes that investors sometimes treat diversification as the only route to efficiency. Intelligent use of leverage or flexible instruments can improve the utility of existing capital without requiring more of it. Portable alpha, for example, separates beta exposure (achieved cheaply through futures or ETFs) from alpha generation, freeing capital that would otherwise be locked in passive positions.
Best for: institutional investors, high-income earners with diversified portfolios
Liquidity impact: medium (leverage increases liquidity demands)
Implementation cost: medium to high (requires derivatives access or structured products)
Time to realized benefit: months to years
Financing and structure strategies
Staged debt financing, revenue-based financing, and self-financing liquidity tools all fall here. The common thread is controlling the cost and timing of capital access rather than relying entirely on equity or traditional bank credit.
For entrepreneurs and real estate investors, a properly structured dividend-paying whole life insurance policy can function as a liquidity-management tool, providing access to capital through policy loans without triggering a taxable event. Dividends on such policies are not guaranteed, and policy loans accrue interest; unpaid loans reduce cash value and the death benefit, and policies can lapse if underfunded. The self-financing real estate examples at The Infinite Banker illustrate how this structure may work in practice for real estate investors.
Best for: entrepreneurs, real estate investors, high-income owners
Liquidity impact: high (policy loans provide on-demand access)
Implementation cost: low to medium (policy design and ongoing premiums)
Time to realized benefit: months to years (cash value accumulates over time)
Operational unit-economics levers
Unit economics improvement is the fastest lever most startups can pull. Norwest’s practical guidance recommends prioritizing unit economics, controlling early sales and marketing spend, and using founder-led sales before scaling a sales team. Each of these reduces the capital required to acquire and retain a customer.
Working capital optimization belongs here too: accelerating receivables by 10 days, extending payables by 15 days, and reducing inventory turns can free meaningful cash without any external financing. Gartner’s CMO survey reported that marketing budgets averaged a moderate single-digit percentage of company revenue in 2024, a useful benchmark when deciding how much to spend on customer acquisition relative to revenue.
Best for: startups, growth-stage companies, any business with variable CAC
Liquidity impact: low to medium
Implementation cost: low (process changes, not capital)
Time to realized benefit: weeks to months
Capex portfolio scrubbing
Many companies carry a long tail of small capital projects that individually seem minor but collectively consume a disproportionate share of the capex budget. McKinsey’s portfolio optimization work shows that focused scrubbing of small capex projects often identifies 15 to 30 percent reductions in sustaining capex in client engagements.
Best for: mid-size to large corporates with fragmented project portfolios
Liquidity impact: high (frees cash immediately)
Implementation cost: low to medium (internal review process)
Time to realized benefit: months
Analytical and portfolio optimization techniques
Marginal analysis, real options, and constrained optimization are practitioner-level tools covered in detail in a later section. These techniques let you compare the marginal return of each dollar across competing uses and value the flexibility of staged decisions.
Pro Tip: Capex scrubbing is one of the most underused levers in corporate finance. Most finance teams review large projects rigorously but let small projects accumulate unchecked. A quarterly small-project triage meeting, even a short one, can surface surprising savings.
What metrics actually measure capital efficiency?
The right metric depends on your context. Using burn multiple to evaluate a mature corporate’s capital program, or ROIC to assess a pre-revenue startup, produces misleading conclusions. The table below maps each metric to its formula and the context where it is most useful.
Metric | Formula | Best used for |
ROIC | Net operating profit after tax / Invested capital | Corporates evaluating whether returns exceed cost of capital |
ROCE | EBIT / Capital employed | Capital-intensive industries; comparable across peers |
Burn multiple | Net cash burned / Net new ARR | Early-stage startups measuring cash efficiency of growth |
ARR-to-capital | Annual recurring revenue / Total capital raised | SaaS startups benchmarking revenue per dollar raised |
CAC:LTV ratio | Customer lifetime value / Customer acquisition cost | Any business with recurring revenue or repeat purchase |
Rule of 40 | Revenue growth rate (%) + EBITDA margin (%) | Growth-stage SaaS; balances growth and profitability |
Payback period | CAC / Monthly gross margin per customer | Startups and growth companies managing cash cycle |
A worked example using burn multiple: if a startup burns $4 million in net cash over a quarter while adding $2 million in net new ARR, the burn multiple is 2.0. A burn multiple below 1.0 is considered strong; above 2.0 signals that growth is consuming capital faster than revenue justifies. VC Beast’s capital efficiency glossary notes that the most capital-efficient path is not always the winning path in winner-take-all markets, which is a critical caveat: efficiency metrics must be read alongside competitive dynamics.
No single metric tells the full story. ROIC misses working capital cycles; burn multiple ignores gross margin quality; the Rule of 40 can be gamed by cutting growth investment. Intuit’s capital allocation frameworks recommend combining metrics into a dashboard that covers profitability, growth, and cash generation simultaneously.
Statistic to note: Gartner’s 2024 CMO survey found marketing budgets at 7.7% of revenue on average. If your CAC is rising while marketing spend holds at that level, the efficiency problem is likely in channel mix or conversion, not total spend.
How do you choose which capital efficiency lever to test first?
Prioritize the lever with the highest marginal return per dollar of implementation effort, given your current liquidity position and time horizon. UBS and BCG’s capital allocation framework recommends treating every dollar as a choice between internal deployment and an external alternative, evaluated on a disciplined, opportunistic basis.
A practical scoring checklist for ranking levers:
Liquidity urgency (weight: 30%) — How quickly do you need the freed capital? Score 1 (low urgency) to 5 (critical).
Measurability (weight: 25%) — Can you calculate a baseline metric today? Score 1 (no data) to 5 (clean data available).
Implementation cost (weight: 20%) — What does it cost in time and money to run a pilot? Score 1 (high cost) to 5 (near-zero cost).
Time to realized benefit (weight: 15%) — How quickly will results appear? Score 1 (years) to 5 (weeks).
Reversibility (weight: 10%) — Can you undo the change if it underperforms? Score 1 (irreversible) to 5 (fully reversible).
Multiply each score by its weight, sum across criteria, and rank your levers. The highest-scoring lever is where you run your first 90-day pilot.
A 90-day mini-experiment template:
Week 1–2: Establish baseline metric (e.g., current burn multiple, current receivables days outstanding).
Week 3–4: Define the intervention (e.g., tighten payment terms from net-60 to net-30 for new customers).
Week 5–10: Run the intervention on a defined subset (new contracts only, one product line, one region).
Week 11–12: Measure delta against baseline. Calculate cost of the pilot (staff time, any systems changes).
Decision point: Scale, adjust, or abandon based on measured results.
Budget for a working capital pilot: typically low, often under $10,000 in staff time for a small business. A capex scrubbing exercise at a mid-size company may require 40 to 80 hours of finance team time.
Pro Tip: Validate unit economics before scaling marketing spend. EY-Parthenon practitioners advise founders to master unit-level profitability first; growth without it tends to amplify losses rather than compound gains.
How to implement capital efficiency changes without common mistakes
The single most important implementation principle: measure first, then change incrementally. Changing multiple levers simultaneously makes it impossible to attribute results to any specific action.
Step-by-step implementation checklist:
Diagnose: Calculate your current baseline for the two or three metrics most relevant to your stage (burn multiple for startups; ROIC for corporates; CAC:LTV for growth companies).
Prioritize: Use the scoring checklist above to rank levers by expected marginal return.
Pilot: Run one change on a bounded scope (one product line, one customer segment, one project category) for 60 to 90 days.
Scale: If the pilot shows improvement at the metric level, expand scope. If not, diagnose before scaling.
Monitor: Set a recurring review cadence (monthly for startups, quarterly for corporates) and track the chosen metric against the pre-pilot baseline.
Typical timelines and resource needs:
Working capital pilot (small business): 60 to 90 days, minimal external cost
Capex portfolio scrubbing (mid-size corporate): 90 to 180 days, internal finance team plus possibly one external advisor
Investment instrument restructuring (investor): 3 to 12 months depending on liquidity and tax considerations
Common pitfalls:
Misreading unit economics: Confusing gross margin with contribution margin, or ignoring fully loaded CAC, leads to false confidence in efficiency gains.
Mistaking short-term efficiency for strategic advantage: Cutting capex or marketing spend can improve near-term metrics while eroding competitive position.
Over-leveraging: Leverage amplifies both gains and losses. AQR’s research on capital-efficient instruments notes that intelligent leverage improves utility, but the word “intelligent” carries weight.
Misaligned incentives: If business unit leaders are measured on revenue growth alone, they will resist working capital changes that slow receivables or tighten credit terms.
Whole life policy misuse: For entrepreneurs using dividend-paying whole life as a liquidity tool, the key risk is underfunding. Dividends are not guaranteed. Policy loans accrue interest and reduce cash value and the death benefit if unpaid. Policies can lapse. The whole life in business financing guide at The Infinite Banker covers these mechanics in detail.
When a pilot underperforms:
Recheck the baseline calculation for errors
Isolate whether the intervention changed behavior or just policy
Test whether external factors (seasonality, market shift) explain the result
Consider a smaller scope or a longer measurement window before abandoning
Which analytical techniques do consultancies actually use?
These techniques let you compare marginal returns across constrained opportunities and assign real value to flexibility. An academic review of analytical and optimization techniques synthesizes the modern toolkit: marginal analysis, constrained optimization, portfolio optimization, real options, and simulation each serve a distinct problem type.
Short methodological notes:
Marginal analysis: Answers “what does the next dollar of investment return?” Required inputs: incremental revenue or cost savings per unit of capital, current capital cost. Typical scale: any size organization.
Constrained optimization: Answers “how do I allocate a fixed capital budget across competing projects to maximize total return?” Required inputs: project return estimates, capital requirements, constraints (regulatory, operational). Typical scale: mid-size to large corporates.
Portfolio optimization: Answers “what mix of assets or projects minimizes risk for a given return target?” Required inputs: return estimates, covariance matrix, constraints. Typical scale: institutional investors, large corporate capex programs.
Real options analysis: Answers “what is the value of the option to wait, expand, contract, or abandon?” Required inputs: volatility of underlying value driver, time horizon, cost of delay. Typical scale: R&D programs, staged infrastructure, early-stage product bets.
Simulation (Monte Carlo): Answers “what is the distribution of outcomes under uncertainty?” Required inputs: probability distributions for key variables. Typical scale: any, but most useful when uncertainty is high and decisions are large.
Technique | Best problem type | Stage | Key input |
Marginal analysis | Incremental spend decisions | Any | Marginal return per dollar |
Constrained optimization | Fixed-budget project selection | Corporate, investor | Project returns, constraints |
Portfolio optimization | Asset/project mix | Investor, large corporate | Returns, covariances |
Real options | Staged decisions with uncertainty | Startup, R&D, capex | Volatility, time, cost of delay |
Simulation | Scenario planning under uncertainty | Any | Variable distributions |
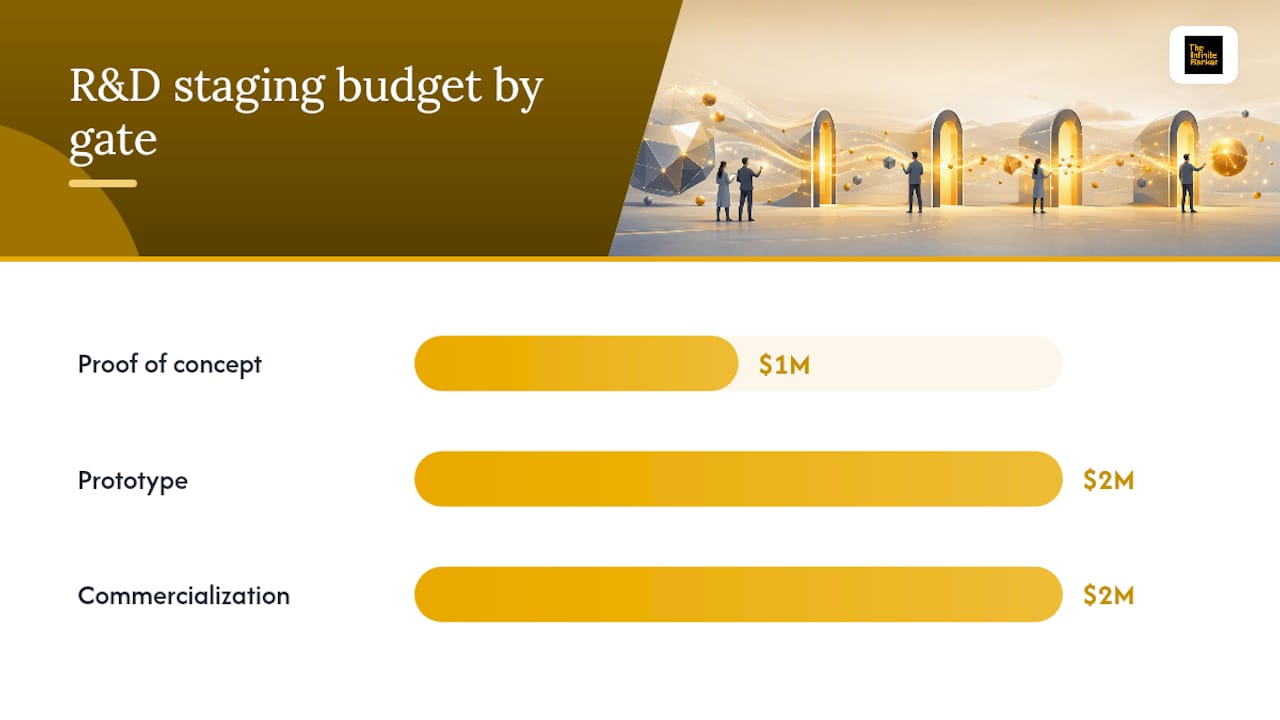
Mini case: real options applied to R&D staging. A company evaluating a $5 million R&D program can structure it as three staged gates: $1 million to proof of concept, $2 million to prototype, $2 million to commercialization. At each gate, management holds the option to expand, delay, or abandon based on results. Real options analysis assigns a dollar value to that flexibility, which a standard net present value calculation ignores entirely. In capital-constrained environments, that optionality value often changes the go/no-go decision.
BCG’s capital allocation research identifies investment governance as one of the three disciplines separating top performers from peers. Real options and simulation are governance tools as much as analytical ones: they force explicit assumptions about uncertainty rather than hiding them inside a single-point forecast.
Three concrete examples: startup, corporate, and investor
Startup: improving burn multiple through unit economics discipline
A SaaS startup with a burn multiple of 2.4 focused on two changes: tightening its sales cycle from 90 days to 45 days by narrowing its ideal customer profile, and shifting from a broad digital marketing approach to founder-led outreach for the first 20 customers. Within two quarters, net new ARR per dollar of cash burned improved materially. The lesson: Norwest’s startup capital efficiency guidance consistently points to CEO-led early sales and measured marketing as the fastest levers for early-stage founders. Scaling a sales team before validating unit economics typically amplifies the problem rather than solving it.
Corporate: capex portfolio scrubbing
A mid-size industrial company carried 140 active small capital projects, each under $500,000, that collectively consumed 38% of the annual capex budget. A structured portfolio review, applying the kind of methodology McKinsey describes in its portfolio optimization work, identified 40 projects with no clear link to strategic priorities. Deferring or canceling those projects reduced sustaining capex by approximately 22%, within the 15 to 30 percent range McKinsey reports from client engagements. The freed capital was reallocated to two high-return growth projects.

Investor: capital-efficient instruments and leverage
An institutional investor holding a large allocation to passive equity used a portion of that position as collateral for a modest leverage overlay, separating beta (achieved cheaply through index futures) from an active return strategy. The result was a higher expected return per dollar of capital committed, with explicit risk controls on the leverage ratio. The lesson: AQR’s research on capital efficiency argues that treating diversification as the ceiling of efficiency leaves return potential on the table for investors with the governance and risk tolerance to use flexible instruments responsibly.
Pro Tip: For high-income owners and entrepreneurs, the high-income diversification practices covered at The Infinite Banker offer a practical lens for thinking about capital allocation across asset classes, not just within a single portfolio.
Where does Infinite Banking fit among capital efficiency strategies?
The perspective here is that Infinite Banking occupies a specific, limited, and often misunderstood position in the broader taxonomy of capital efficiency strategies. It is not a replacement for ROIC improvement, capex scrubbing, or the unit economics discipline. It is a financing and liquidity-management tool, and it works best for a narrow audience: entrepreneurs, real estate investors, and high-income owners who need reliable, on-demand access to capital without disrupting existing investments or triggering immediate tax consequences.
A properly structured dividend-paying whole life insurance policy can function as a personal line of credit against accumulated cash value. Policy loans do not require credit approval, do not appear on a credit report, and do not interrupt the policy’s continued participation in any dividends the insurer declares. That last point matters: dividends are not guaranteed, and the insurer’s dividend scale can change. Policy loans accrue interest. If loans are not repaid, they reduce cash value and the death benefit, and the policy can lapse.
The fit is clearest for entrepreneurs who cycle capital frequently, real estate investors who need bridge liquidity between acquisitions, and high-income owners who want a capital reserve that is not correlated with public market volatility. For a startup burning cash to find product-market fit, or a corporate CFO managing a large capex program, other levers in this taxonomy will almost always produce faster and more measurable results.
Jib Hunt, an Authorized IBC Practitioner at The Infinite Banker, frames it this way: Infinite Banking is a capital-control strategy, not a capital-growth strategy. The distinction matters for anyone evaluating it as part of a broader financial efficiency program.
The Infinite Banker can help you apply these strategies
The Infinite Banker works with entrepreneurs, real estate investors, and high-income earners who want to add a structured liquidity layer to their capital efficiency program through properly designed dividend-paying whole life insurance.
Services include strategy sessions to evaluate whether Infinite Banking fits your capital structure, policy design tailored to your cash flow cadence, underwriting guidance, and ongoing education about how policy loans and cash value mechanics interact with your broader financial plan. The Infinite Banking Calculator lets you model how cash value access may affect your liquidity position before committing to a policy. If you want to understand whether this approach fits your situation, the Who Infinite Banking Is For page outlines the client profiles The Infinite Banker serves. No outcomes are promised or implied. Consult qualified professionals before acting.
Sources
This post is educational only and not financial, tax, or legal advice. Consult qualified professionals before acting.
Recommended
Comments